
Angular PrimeNG Line Chart Component
Angular PrimeNG is an open-source framework with a rich set of native Angular UI components that are used for great styling and this framework is used to make responsive websites with very much ease. It provides a lot of templates, components, theme design, an extensive icon library, and much more. In this article, we are going to learn Angular PrimeNG Line Chart Component
A line chart or line graph is a type of chart used to display information as a series of data points that act as a dataset called markers connected with lines. The line chart can be modified to save single axes or multiple axes.
Syntax:
<p-chart type="line" [data]="basicData"></p-chart>
app.component.ts:
this.basicData = {
    labels: ['January', 'February', 'March',
        'April', 'May', 'June', 'July'],
    datasets: [
        {
            label: '2020',
            data: [65, 59, 80, 81, 56, 55, 40],
        },
    ],
};
Creating Angular application & Module Installation:
Step 1: Create an Angular application using the following command.
ng new geeks_angular
Step 2: After creating your project folder i.e. geeks_angular, move to it using the following command.
cd geeks_angular
Step 3: Install PrimeNG in your given directory.
npm install primeng --save
npm install primeicons --save
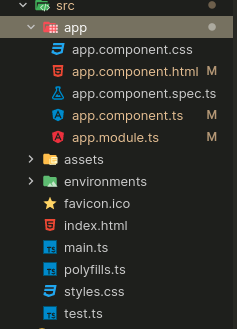
Project Structure:
Example 1: In the following example, we have a Line chart with two datasets.
- app.component.html:
<h1 style="color: green; text-align:center;">
    GeeksforGeeks
</h1>
<h3>Angular PrimeNG Line Chart Component</h3>

<p-chart type="line"
         [data]="basicData"
         [options]="basicOptions">
</p-chart>
- app.component.ts
import { Component } from '@angular/core';
import { MessageService } from 'primeng/api';
import { PrimeNGConfig } from 'primeng/api';

@Component({
    selector: 'app-root',
    templateUrl: './app.component.html',
    providers: [MessageService],
})
export class AppComponent {
    basicData: any;
    basicOptions: any;
    constructor(
        private messageService: MessageService,
        private primengConfig: PrimeNGConfig
    ) { }
    ngOnInit() {
        this.basicData = {
            labels: ['January', 'February', 'March',
                'April', 'May', 'June', 'July'],
            datasets: [
                {
                    label: '2020',
                    data: [65, 59, 80, 81, 56, 55, 40],
                    fill: false,
                    borderColor: '#AA2324',
                    tension: 0.4,
                },
                {
                    label: '2021',
                    data: [28, 48, 40, 19, 86, 27, 90],
                    fill: false,
                    borderColor: '#177300',
                    tension: 0.4,
                },
            ],
        };
        this.basicOptions = {
            title: {
                display: true,
                text: 'Article Views',
                fontSize: 32,
                position: 'top',
            },
            scales: {
                x: {
                    ticks: {
                        color: '#495057',
                    },
                    grid: {
                        color: '#ebedef',
                    },
                },
                y: {
                    ticks: {
                        color: '#495057',
                    },
                    grid: {
                        color: '#ebedef',
                    },
                },
            },
        };
    }
}
- app.module.ts
import { NgModule } from '@angular/core';
import { BrowserModule } from '@angular/platform-browser';
import { FormsModule } from '@angular/forms';
import { HttpClientModule } from '@angular/common/http';
import { BrowserAnimationsModule } from
    '@angular/platform-browser/animations';

import { AppComponent } from './app.component';

import { ButtonModule } from 'primeng/button';
import { ToastModule } from 'primeng/toast';
import { RippleModule } from 'primeng/ripple';
import { ImageModule } from 'primeng/image';
import { ChartModule } from 'primeng/chart';
@NgModule({
    imports: [
        BrowserModule,
        BrowserAnimationsModule,
        ToastModule,
        ButtonModule,
        RippleModule,
        FormsModule,
        ImageModule,
        ChartModule,
    ],
    declarations: [AppComponent],
    bootstrap: [AppComponent],
})
export class AppModule { }
Output:

Example 2: In the following example, we have applied some styles to the Line chart.
- app.component.html
<h1 style="color: green; text-align:center;">
    GeeksforGeeks
</h1>
<h3>Angular PrimeNG Line Chart Component</h3>

<p-chart type="line"
         [data]="basicData"
         [options]="basicOptions">
</p-chart>
- app.component.ts
import { Component } from '@angular/core';
import { MessageService } from 'primeng/api';
import { PrimeNGConfig } from 'primeng/api';

@Component({
    selector: 'app-root',
    templateUrl: './app.component.html',
    providers: [MessageService],
})
export class AppComponent {
    basicData: any;
    basicOptions: any;
    constructor(
        private messageService: MessageService,
        private primengConfig: PrimeNGConfig
    ) { }
    ngOnInit() {
        this.basicData = {
            labels: ['January', 'February', 'March',
                'April', 'May', 'June', 'July'],
            datasets: [
                {
                    label: '2020',
                    data: [65, 59, 80, 81, 56, 55, 40],
                    fill: false,
                    tension: 0.4,
                    borderColor: '#42A5F5',
                },
                {
                    label: '2021',
                    data: [28, 48, 40, 19, 86, 27, 90],
                    fill: false,
                    borderDash: [5, 5],
                    tension: 0,
                    borderColor: '#66BB6A',
                },
                {
                    label: '2022',
                    data: [12, 51, 62, 33, 21, 62, 45],
                    fill: true,
                    borderColor: '#FFA726',
                    tension: 0.4,
                    backgroundColor: 'rgba(255,167,38,0.2)',
                },
            ],
        };
        this.basicOptions = {
            title: {
                display: true,
                text: 'Article Views',
                fontSize: 32,
                position: 'top',
            },
            scales: {
                x: {
                    ticks: {
                        color: '#495057',
                    },
                    grid: {
                        color: '#ebedef',
                    },
                },
                y: {
                    ticks: {
                        color: '#495057',
                    },
                    grid: {
                        color: '#ebedef',
                    },
                },
            },
        };
    }
}
- app.module.ts
import { NgModule } from '@angular/core';
import { BrowserModule } from '@angular/platform-browser';
import { FormsModule } from '@angular/forms';
import { HttpClientModule } from '@angular/common/http';
import { BrowserAnimationsModule } from
    '@angular/platform-browser/animations';

import { AppComponent } from './app.component';

import { ButtonModule } from 'primeng/button';
import { ToastModule } from 'primeng/toast';
import { RippleModule } from 'primeng/ripple';
import { ImageModule } from 'primeng/image';
import { ChartModule } from 'primeng/chart';
@NgModule({
    imports: [
        BrowserModule,
        BrowserAnimationsModule,
        ToastModule,
        ButtonModule,
        RippleModule,
        FormsModule,
        ImageModule,
        ChartModule,
    ],
    declarations: [AppComponent],
    bootstrap: [AppComponent],
})
export class AppModule { }
Output:

Reference: http://primefaces.org/primeng/chart/line

