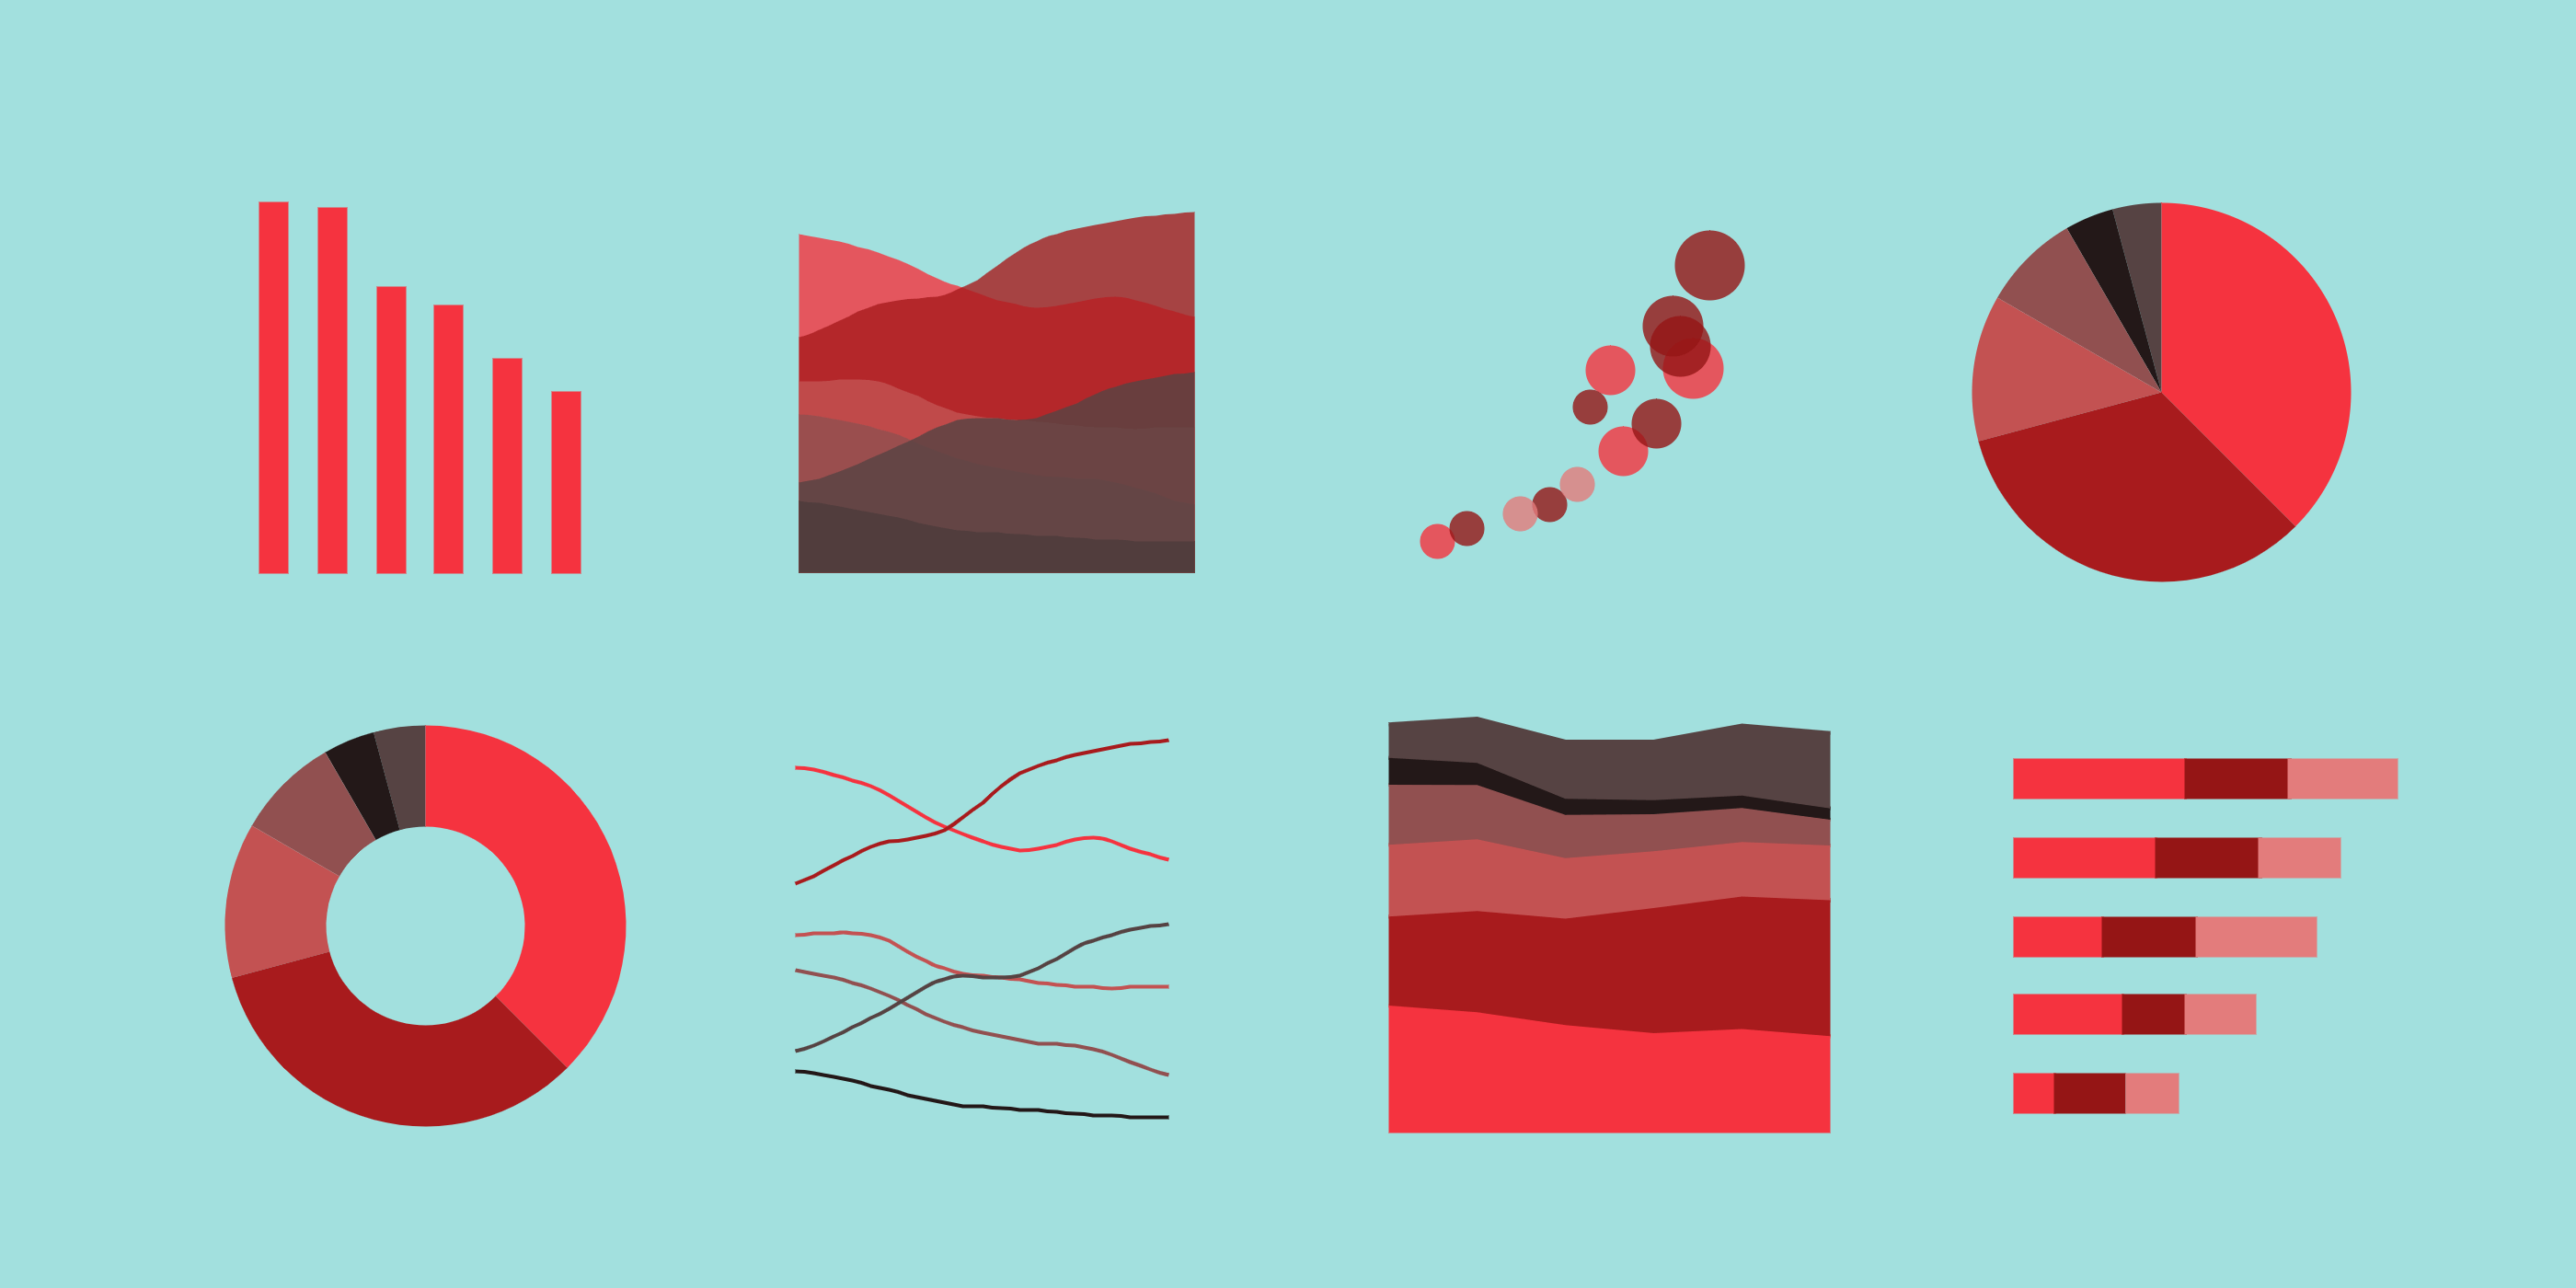
The purpose of this repository is to serve as a reference guide for creating various types of data visualizations using Python. Upon completion, it will feature over 25 visualizations, utilizing more than 5 datasets, some of which will be scraped from websites.
- Python
- Matplolib
- Pandas
- NumPy
- Seaborn
https://archive-beta.ics.uci.edu/
under development
under development
