Conversation

shnizzedy

Summary

Fixes #2982. Maybe fixes #3527.

All tests pass locally. 8/13 jobs pass on Travis. The Travis failures seem unrelated to the changes in this PR.
After rebase, all tests pass.

List of changes proposed in this PR (pull-request)

  • Updates
    def generate_gantt_chart(
    to handle changes to profiler
  • Adds a test
    @pytest.mark.parametrize("plugin", ["Linear", "MultiProc", "LegacyMultiProc"])
    def test_callback_gantt(tmpdir, plugin):
    import logging
    import logging.handlers
    from os import path
    from nipype.utils.profiler import log_nodes_cb
    from nipype.utils.draw_gantt_chart import generate_gantt_chart
    log_filename = path.join(tmpdir, "callback.log")
    logger = logging.getLogger("callback")
    logger.setLevel(logging.DEBUG)
    handler = logging.FileHandler(log_filename)
    logger.addHandler(handler)
    # create workflow
    wf = pe.Workflow(name="test", base_dir=tmpdir.strpath)
    f_node = pe.Node(
    niu.Function(function=func, input_names=[], output_names=[]), name="f_node"
    )
    wf.add_nodes([f_node])
    wf.config["execution"] = {"crashdump_dir": wf.base_dir, "poll_sleep_duration": 2}
    plugin_args = {"status_callback": log_nodes_cb}
    if plugin != "Linear":
    plugin_args["n_procs"] = 8
    wf.run(plugin=plugin, plugin_args=plugin_args)
    generate_gantt_chart(
    path.join(tmpdir, "callback.log"), 1 if plugin == "Linear" else 8
    )
    assert path.exists(path.join(tmpdir, "callback.log.html"))
    to make sure the Gantt chart HTML page generates without error
  • Adds myself as a contributor to .zenodo.json

Acknowledgment

  • (Mandatory) I acknowledge that this contribution will be available under the Apache 2 license.

@shnizzedy

As noted

[T]here is an issue with the number of threads being estimated by the callback, or the gantt chart creation script is pulling in the wrong numbers. Some of the nodes are reporting using 210 threads!

Originally posted by @ccraddock in FCP-INDI/C-PAC#1404 (comment)

I thought maybe runtime_threads was counting something different than I expected.

I see the profile uses cpu_percent for runtime_threads which returns a percentage of a CPU, so I think something like math.ceil(cpu_percent)/100 would be an estimate of the number of threads, but there's some disconnected code that looks like it collects the actual number of threads used (as opposed to percentage of 1 CPU).

Originally posted by @shnizzedy in FCP-INDI/C-PAC#1404 (comment)

I think estimating the number of threads (by dividing by cpu_percent 100 and rounding up) is good enough for what I'm trying to do.

callback.log.html screenshot

Originally posted by @shnizzedy in FCP-INDI/C-PAC#1404 (comment)

I think the issues of

  1. what runtime_threads is logging and
  2. whether the number of threads used by a node is recorded

are related to this PR and issue, but beyond the scope of these changes. C-PAC has its own callback function in which I'm dividing and rounding, so I made no changes regarding runtime_threads in Nipype.

@codecov

Codecov Report

Attention: coverage is 95.38462% with 3 lines in your changes missing coverage. Please review.

Project coverage is 73.15%. Comparing base (5dc8701) to head (7223914).
Report is 50 commits behind head on master.

Files with missing lines%Lines
nipype/utils/draw_gantt_chart.py90.32%3 Missing⚠️
Additional details and impacted files
@@            Coverage Diff             @@
##           master    #3290      +/-   ##
==========================================
+ Coverage   72.86%   73.15%   +0.28%     
==========================================
  Files        1278     1278              
  Lines       59305    59356      +51     
==========================================
+ Hits        43212    43419     +207     
+ Misses      16093    15937     -156     

☔ View full report in Codecov by Sentry.
📢 Have feedback on the report? Share it here.

Choose a reason for hiding this comment

The reason will be displayed to describe this comment to others. Learn more.

Looks reasonable, though I don't have any experience with this bit of the code. Inclined to merge tomorrow unless someone complains.

@shnizzedy

My only hesitance is the potentially misleading runtime_threads ― maybe that should be fixed before restoring this functionality?

Choose a reason for hiding this comment

The reason will be displayed to describe this comment to others. Learn more.

Looks good, just some minor nits.

My only hesitance is the potentially misleading runtime_threads ― maybe that should be fixed before restoring this functionality?

I agree 👍

shnizzedy added a commit to shnizzedy/nipype that referenced this pull request Apr 1, 2021
@effigies

My only hesitance is the potentially misleading runtime_threads ― maybe that should be fixed before restoring this functionality?

I agree

Was this fixed? What needs doing?

@shnizzedy

Was this fixed? What needs doing?

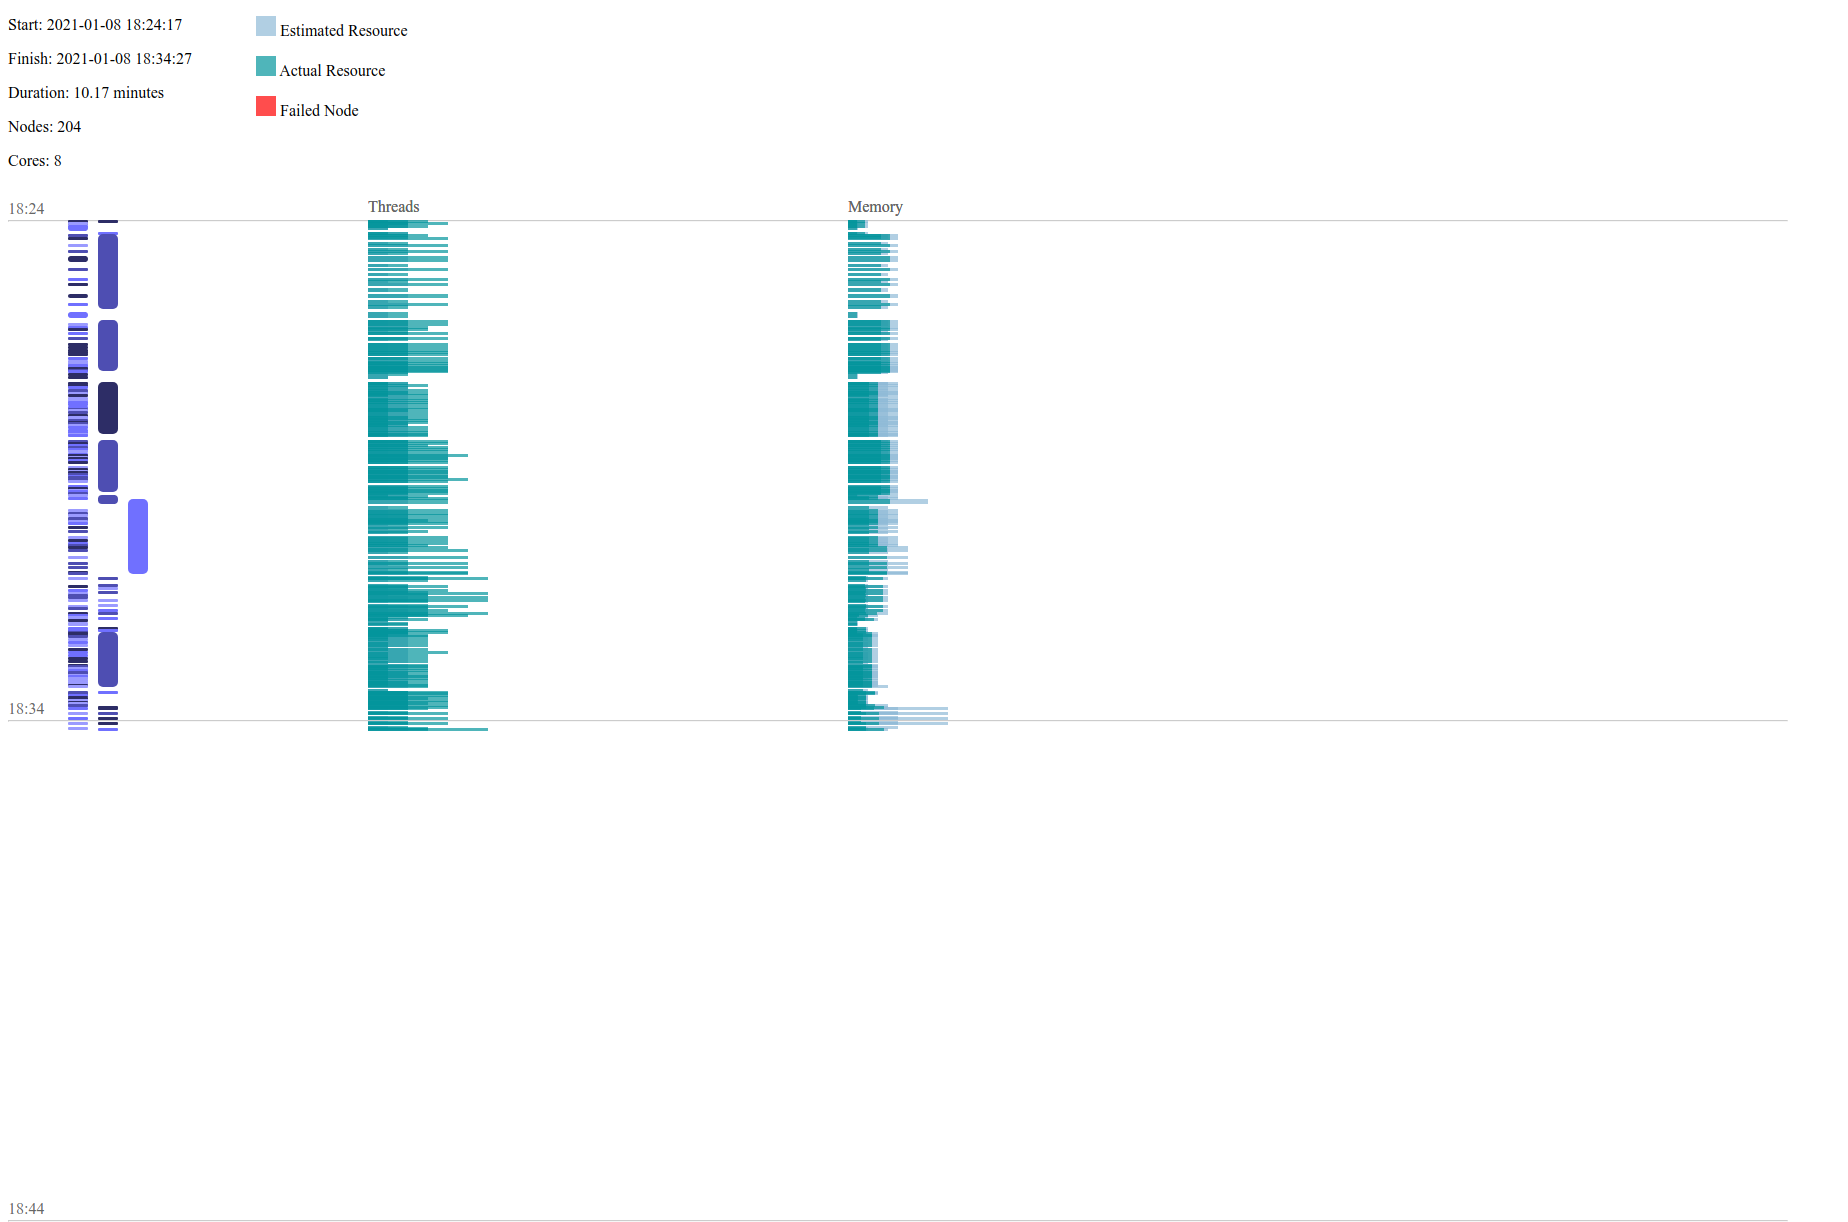
I haven't fixed it (yet at least). The issue is that the chart uses runtime_threads from the callback log as a count of threads observed being used at runtime, but the value actually stored there is cpu_percent,

"runtime_threads": getattr(node.result.runtime, "cpu_percent", "N/A"),

a float representing the current process CPU utilization as a percentage

This leads to thread counts in the hundreds when they're expected to be in the ones, like Gantt chart screenshot with CPU percent in "Threads"

So I think the "threads" part of these charts should be changed before the chart functionality is restored, either

  • by updating the log to include an integer count of threads and use this value in the chart
  • change the column from threads to CPU percentage
  • something else?

@effigies

Yeah, seems like we want something like:

if status_dict['runtime_threads'] != "N/A":
    status_dict['runtime_threads'] //= 100

@shnizzedy

An existing unit test does

assert (
int(result.runtime.cpu_percent / 100 + 0.2) == n_procs
), "wrong number of threads estimated"

which is similar to what we're doing for now in C-PAC:

if runtime_threads != 'N/A':
    runtime_threads = math.ceil(runtime_threads/100)

My concern is that, as I read

Note: the returned value can be > 100.0 in case of a process running multiple threads on different CPU cores.
Note: the returned value is explicitly not split evenly between all available CPUs (differently from psutil.cpu_percent()). This means that a busy loop process running on a system with 2 logical CPUs will be reported as having 100% CPU utilization instead of 50%. This was done in order to be consistent with top UNIX utility and also to make it easier to identify processes hogging CPU resources independently from the number of CPUs. It must be noted that taskmgr.exe on Windows does not behave like this (it would report 50% usage instead). To emulate Windows taskmgr.exe behavior you can do: p.cpu_percent() / psutil.cpu_count().

psutil documentation: Process.cpu_percent

this number can be a misleading estimate. For example, if a process is using 25% of each of 4 CPUs, I believe this would report 100%, which would reduce to 1 or 2 threads depending on how we're rounding up or not. I'd be happy to learn that either I'm misunderstanding the number or that the number is good enough.

@effigies

@shnizzedy Can you rebase/merge master to resolve conflicts? I think we let this go too long and should just merge and let people find bugs and fix them.

shnizzedy added a commit to shnizzedy/nipype that referenced this pull request Nov 18, 2024
@shnizzedyshnizzedy force-pushed the fix/gantt-chart branch 2 times, most recently from e644bdd to 1bce774 Compare November 18, 2024 17:17
@shnizzedyshnizzedy marked this pull request as draft November 18, 2024 17:33
shnizzedy added a commit to shnizzedy/nipype that referenced this pull request Nov 18, 2024

Choose a reason for hiding this comment

The reason will be displayed to describe this comment to others. Learn more.

Passing tests! Small comments.

shnizzedy and others added 2 commits November 18, 2024 14:27
Co-authored-by: Chris Markiewicz <[email protected]>
@shnizzedy

Do we want to do this

if status_dict['runtime_threads'] != "N/A":
    status_dict['runtime_threads'] //= 100

in this PR or kick the can on it?

@effigies

Let's kick the can. If you want to open another PR in 5 minutes, that's fine with me. Last time we had that question, it delayed things 3 years.

@effigieseffigies marked this pull request as ready for review November 18, 2024 19:38
@effigieseffigies merged commit 2e36f69 into nipy:master Nov 18, 2024
25 checks passed
@shnizzedyshnizzedy deleted the fix/gantt-chart branch December 20, 2024 17:25
@shnizzedyshnizzedy restored the fix/gantt-chart branch December 20, 2024 17:25
Sign up for free to join this conversation on . Already have an account? Sign in to comment
None yet
None yet

Successfully merging this pull request may close these issues.

generate_gantt_chart fails to convert strings to datetime objects generate_gantt_chart fails on logfile